
A map, application, or analysis may depend on many sources, processing jobs, storage systems, and serving tools. Architecture diagrams often place all of them in one vertical stack. The result may show what exists without showing who operates each part or whether a dataset is ready for its intended use.
Those omissions matter in production. A preserved source does not carry the same guarantees as prepared data. A prepared dataset does not automatically have the ownership and business meaning required of a governed product. Teams need a clearer way to describe both the production system and the data moving through it.
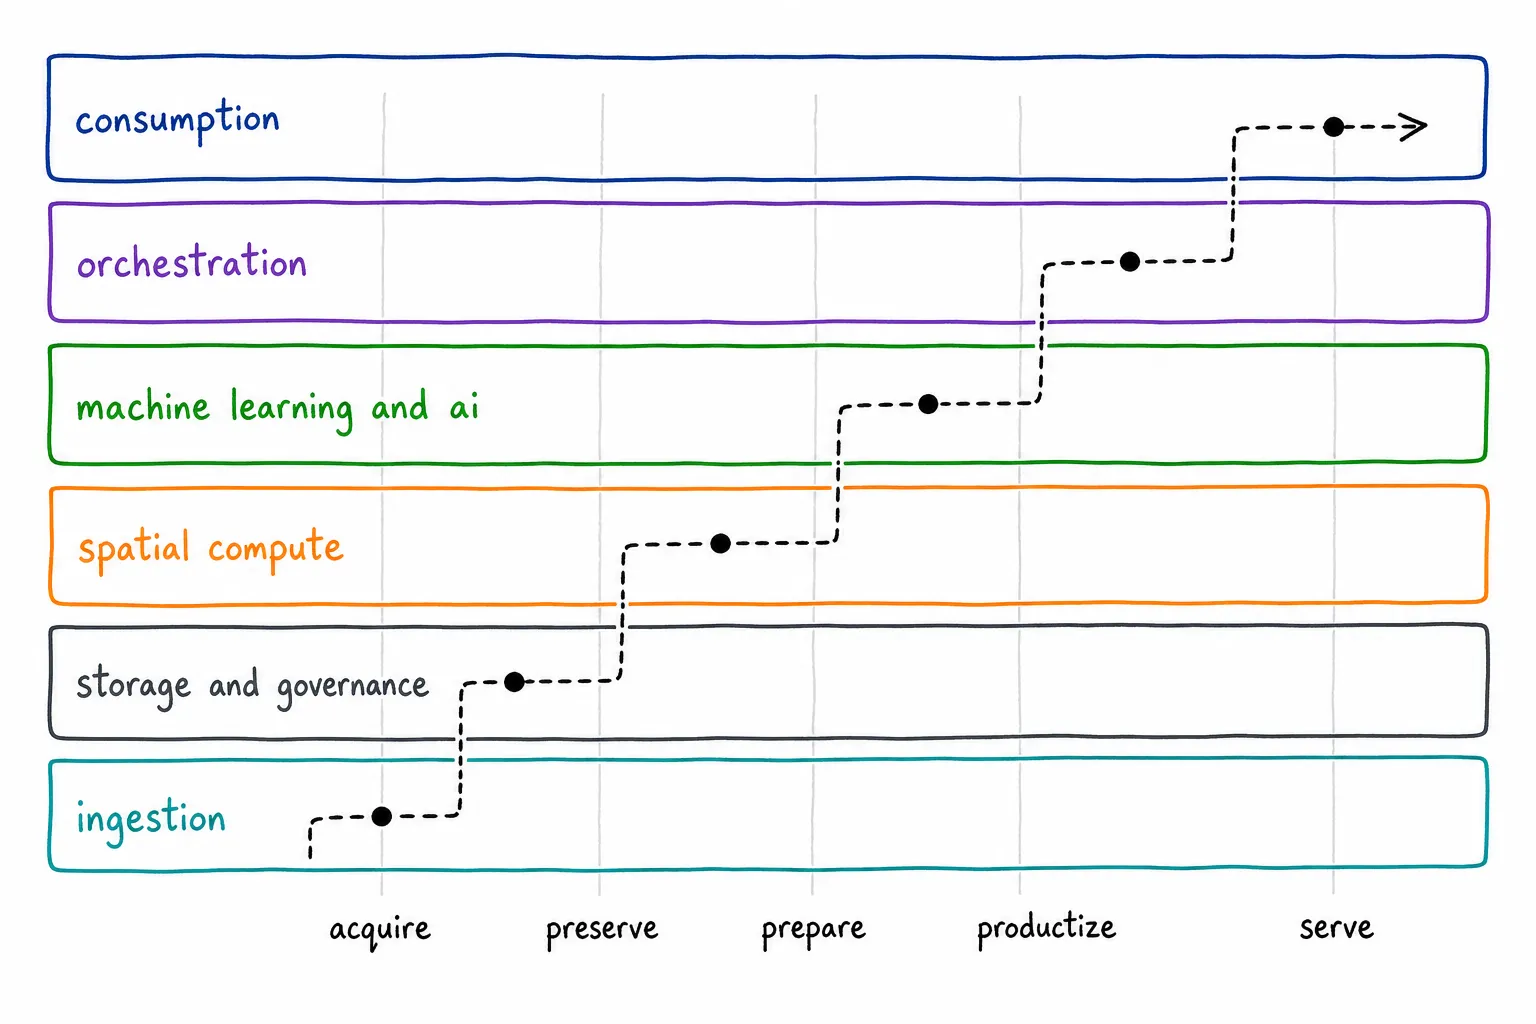
The two models of the Geospatial Lakehouse Stack: six capability layers own the work while one workload’s data climbs through the five lifecycle states.
What is the Geospatial Lakehouse Stack?
The Geospatial Lakehouse Stack is a two-model description of a production geospatial system. Its capability model has six layers that state what the system must do. Its lifecycle model has five states that identify the condition of its data.
A geospatial lakehouse is a governed data platform that keeps geospatial tables and files under shared catalog, access, and lineage controls. Its architecture must account for services, processing steps, and data states. These categories answer different operational questions.
A source connector is a service. Geometry validation is a processing step. An analysis-ready table is a data state. Placing all three at equivalent levels in one diagram makes ownership and readiness difficult to interpret. The diagram may not reveal who runs the validation, which system controls access, or whether a consumer can rely on the resulting table.
The capability axis asks which capability performs and owns the work. The lifecycle axis asks what state the data has reached and what may use it. Separating these axes makes each diagram more precise without separating the system itself.
What must the production system provide?
The capability model assigns every part of the production system to one of six layers. It does not prescribe a vendor or require a separate service for each layer.
-
Ingestion brings data through a governed entry point. It covers incremental file ingestion, database and application connectors, and streaming paths for live feeds. The same boundary receives vector data, tabular records, raster data, which represents spatial information as a grid of values, and scientific arrays.
-
Storage and governance retains data and controls its use. Governed tables hold spatial values, while a governed file store holds raster and point-cloud data. Point-cloud data represents locations as collections of measured points. A shared catalog records lineage and access controls across both forms. Governed sharing avoids unmanaged exports.
-
Spatial compute performs geographic analysis. It includes spatial queries over vector data, relationship analysis, and processing for raster data. A discrete global grid index divides the world into addressable cells for spatial organization. H3 and S2 are examples of this type of index.
-
Machine learning and AI manages features, experiments, models, inference, model serving, and vector search against governed data. A model registry records approved models and their status. Feature management controls the data used to train or run those models.
-
Orchestration coordinates when and how work runs. It expresses scheduled or declarative pipelines, manages incremental refreshes, and keeps streaming jobs active for operational workloads.
-
Consumption connects governed outputs to their users. It includes dashboards with maps, natural-language queries, custom applications, governed sharing, and low-latency services for operational systems.
The review rule is direct: every source, store, processing engine, model, orchestrator, and serving surface should map to a capability layer. A component that maps nowhere needs an explicit reason. A component that duplicates another owner also needs an explicit reason.
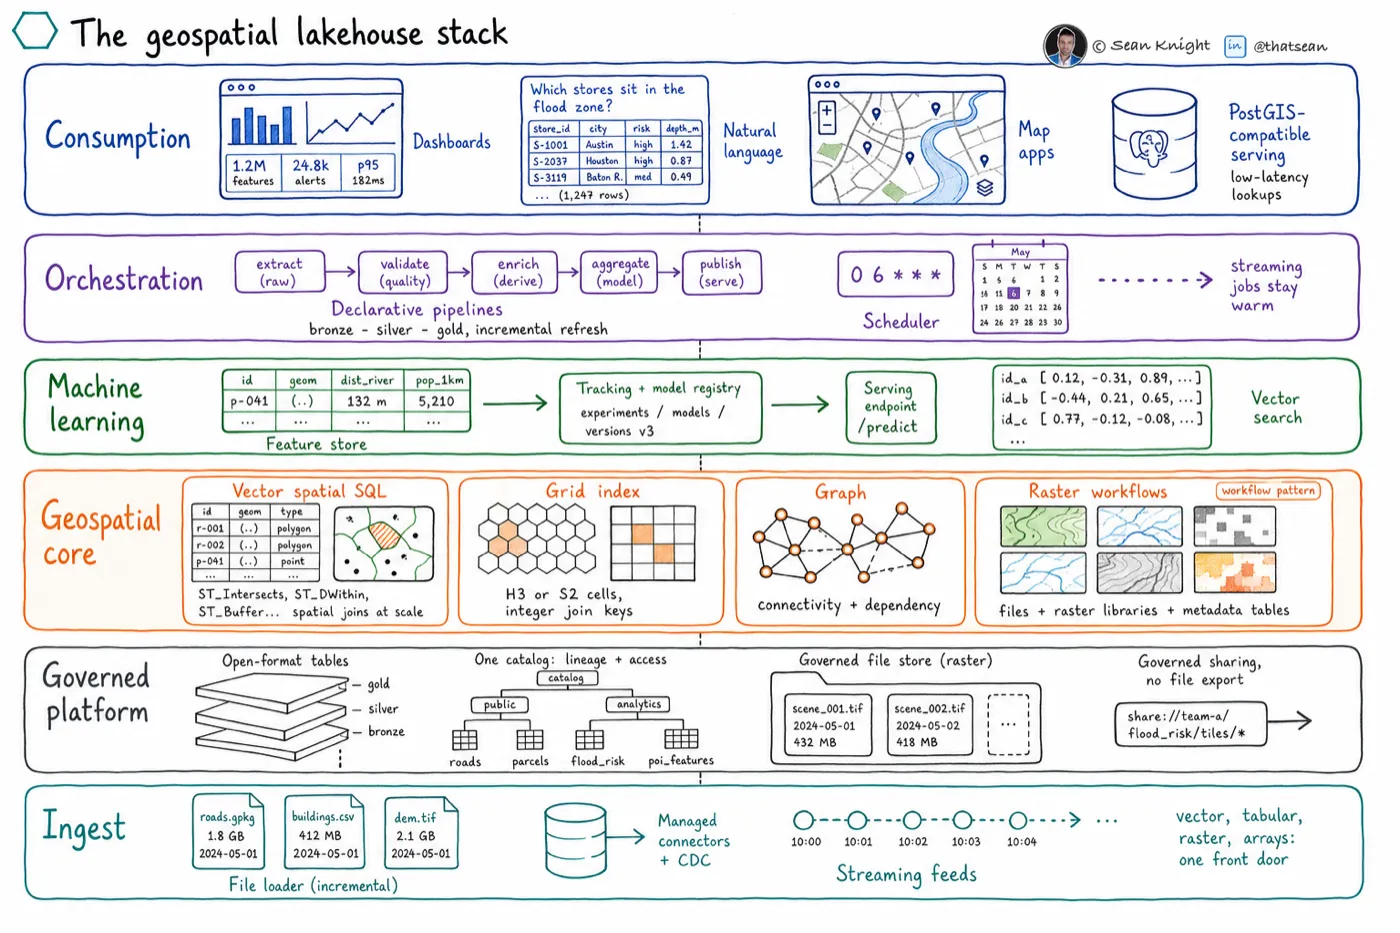
The six capability layers of the Geospatial Lakehouse Stack, platform neutral, drawn with consumption at the top and ingestion at the bottom.
When is data ready for its next use?
The lifecycle model follows data from its provider to its consumer. Each of its five states carries a different set of responsibilities and guarantees.
-
Acquire covers discovering, licensing, tasking, receiving, or transferring data from a provider.
-
Preserve retains the source faithfully enough to reproduce every downstream representation.
-
Prepare validates, normalizes, indexes, and physically arranges data for its intended analysis.
-
Productize creates a governed output with explicit business meaning, quality, ownership, and lineage.
-
Serve presents fit-for-purpose representations to maps, applications, analysts, models, and partners.
These states must appear in catalog metadata rather than remain implied by a folder location. Metadata should record the lifecycle state, producer, quality gates, and lineage for each governed representation. A valid source file may still be unsuitable for analysis. An analysis-ready dataset may still lack the ownership or meaning required of a business product.
One source can exist in several states through separate representations. The preserved version can remain unchanged while prepared and product representations are derived from it. Each representation needs its own state and lineage.
The separate Geospatial Medallion Architecture maps these states onto the familiar medallion layer names: acquire, bronze, silver, gold, and serve.
How does one enrichment workload cross both models?
Point-to-polygon enrichment assigns each located record to the reference polygon that contains it. The workload illustrates how capability layers perform work as data advances through lifecycle states.
The ingestion capability receives the reference polygons and located records. Both sources reach the acquire state. Storage and governance then retains faithful source representations, which places them in the preserve state.
Spatial compute validates the geometries and builds the indexes needed for analysis. The resulting representations reach the prepare state. Spatial compute then performs the point-to-polygon operation and creates the enriched output. Once that output has explicit meaning, quality, ownership, and lineage, it reaches the productize state.
Orchestration coordinates these steps, including their schedule and refresh behavior. Consumption presents the governed result to its intended users or systems, which places the representation in the serve state.
The lifecycle model records how the data changes. The capability model identifies what performs each change and who owns that work.
Where does the model allow implementation choice?
A production workload often touches most capability layers, but it may not need a distinct component for every layer. One platform service can satisfy several capabilities if its ownership, behavior, and operating boundary remain clear. A specialist engine can also provide part of one capability through a governed connection to the primary platform.
A team may choose a native service, an operated workflow, or a connected specialist engine. That choice changes ownership, cost, reliability, and required skill. It does not change the lifecycle state that the workload must produce.
The models also do not require every workload to use every capability. The point-to-polygon example does not require machine learning. The capability still belongs in the production model because other workloads may need it.
How can a team apply the stack to a real product?
Begin with one product.
-
Name the decision and consumer. Choose an output tied to a real business action rather than beginning with a platform-wide migration.
-
Map the capabilities. Assign every source, store, engine, model, orchestrator, and serving surface to a layer and an owner.
-
Record lifecycle state. Define the quality, lineage, and reproducibility gate required before each important dataset moves forward.
-
Expose operating boundaries. Label what the platform operates and what the implementation team must build and maintain.
The stack page of the LakeGeo architecture presents the formal model. The four steps above are usually enough to reveal missing ownership, duplicated components, and unstated quality gates within the first product.
About the author
Sean Knight is a serial entrepreneur in the San Francisco Bay Area who builds products and companies around AI and geospatial data. He opened his first business, a retail computer shop, at 17, then began his career as an astrophysicist. From there he moved into remote sensing and machine learning, eventually flying drones over glaciers in Alaska and New Zealand to build 3D point clouds. Today he runs LakeGeo, consults on AI, and builds AI agents that run geospatial pipelines on platforms like Databricks. Find him on LinkedIn.
See more LakeGeo in your Google Search and AI results.
Make LakeGeo a preferred source on Google